Here is a look at the real estate market report for the Scottsdale, AZ area.
Average Price for Homes and Condos Sold in Scottsdale by Month
The average sale price for single-family homes and condos in Scottsdale in April 2019 is $640,932. In April 2018, the average sale price was $585,917, which shows a year over year increase of 9.39%.
| Month-Year | Average Sale Price |
| April-19 | $640,932 |
| March-19 | $606,258 |
| February-19 | $603,154 |
| January-19 | $600,397 |
| December-18 | $580,689 |
| November-18 | $580,099 |
| October-18 | $593,546 |
| September-18 | $568,114 |
| August-18 | $577,751 |
| July-18 | $547,587 |
| June-18 | $611,939 |
| May-18 | $610,141 |
| April-18 | $585,918 |
The average sale price for rental listings in Scottsdale in April 2019 was $2220, which is just slightly higher than April 2018, $2085.
| Month-Year | Average Rental Price |
| April-19 | $2220 |
| March-19 | $2207 |
| February-19 | $2307 |
| January-19 | $2242 |
Existing Scottsdale Home Sales
In April 2019 848 single-family homes, condos and townhomes were sold in Scottsdale. Total properties sold in Scottsdale
| Single Family Homes | 530 |
| Patio Homes | 38 |
| Condos/Townhomes | 277 |
| Lofts | 1 |
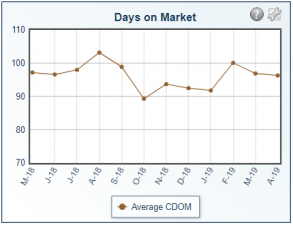
Average Days on Market for Scottsdale
The average cumulative days on market for homes, condos, and townhouses in Scottsdale for April 2019 is 96, which is the same as March 2019, and slightly higher than April 2018, which was 91 days.

Scottsdale Listing Statistics
The total number of new listings in Scottsdale in April 2019 was 1083, with a total of 3053 active, and 848 sold, showing our current inventory is just slightly higher than last March. Sales were slightly lower this time last year.
| Month | New | Active | Sold | Months Of Inventory |
| 19-Apr | 1083 | 3053 | 848 | 3.6 |
| 19-Mar | 1119 | 3103 | 768 | 4.04 |
| 19-Feb | 1009 | 3011 | 617 | 4.88 |
| 19-Jan | 1244 | 2757 | 495 | 5.57 |
| 18-Dec | 587 | 2610 | 558 | 4.68 |
| 18-Nov | 862 | 2682 | 589 | 4.55 |
| 18-Oct | 1033 | 2480 | 595 | 4.17 |
| 18-Sep | 884 | 2299 | 552 | 4.16 |
| 18-Aug | 863 | 2266 | 709 | 3.2 |
| 18-Jul | 702 | 2331 | 756 | 3.08 |
| 18-Jun | 909 | 2579 | 853 | 3.02 |
| 18-May | 937 | 2815 | 960 | 2.93 |
| 18-Apr | 1089 | 3004 | 871 | 3.45 |
| 18-Mar | 1212 | 3027 | 879 | 3.44 |
Scottdale’s Average List Price to Close Price
The average original list price is 97% of the close price for homes in Scottsdale and the same for condos/townhomes for April 2019, which is the same percentage as March 2019.
Please visit the Cactus Valley Realty website for the National, Maricopa County, and the greater Phoenix Metro Area real estate market report

